Village of Pinecrest 2016 Annual Market Report
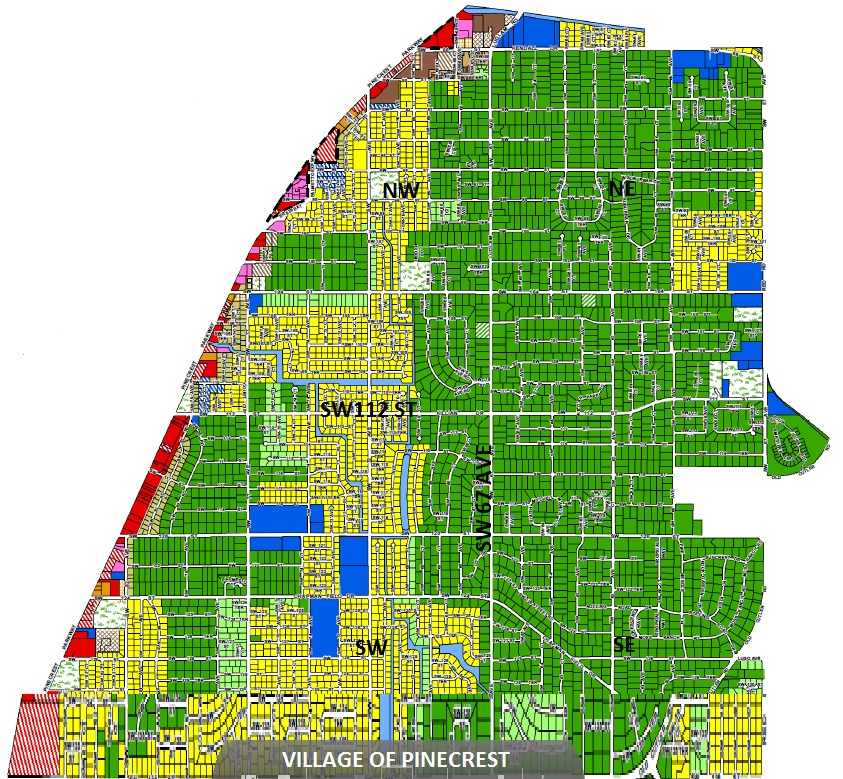
Jump in and enjoy my Village of Pinecrest 2016 Annual Market Report – the most comprehensive analysis of single-family home sales in Pinecrest. Sales data is divided into quadrants, with SW 112th Street representing the division between north and south and SW 67th Avenue representing the division between east and west. (See map below).
Pinecrest 2016 Annual Market Report
Pinecrest home sales in 2016 were quite interesting in comparison to 2015.
- Total number of sales of single family homes was down 9% (17 fewer homes sold in 2016).
- The total sales volume was down $5 million or 2% in 2016.
- The average sale price was up $86,316 or 6% last year vs 2015.
- The average sale price per square foot (SP/SF) was up $12 or 4% in 2016.
Although sales were down by 9%, the average price was up by 6%, keeping the total sales volume a mere 2% off from the 2015 value.
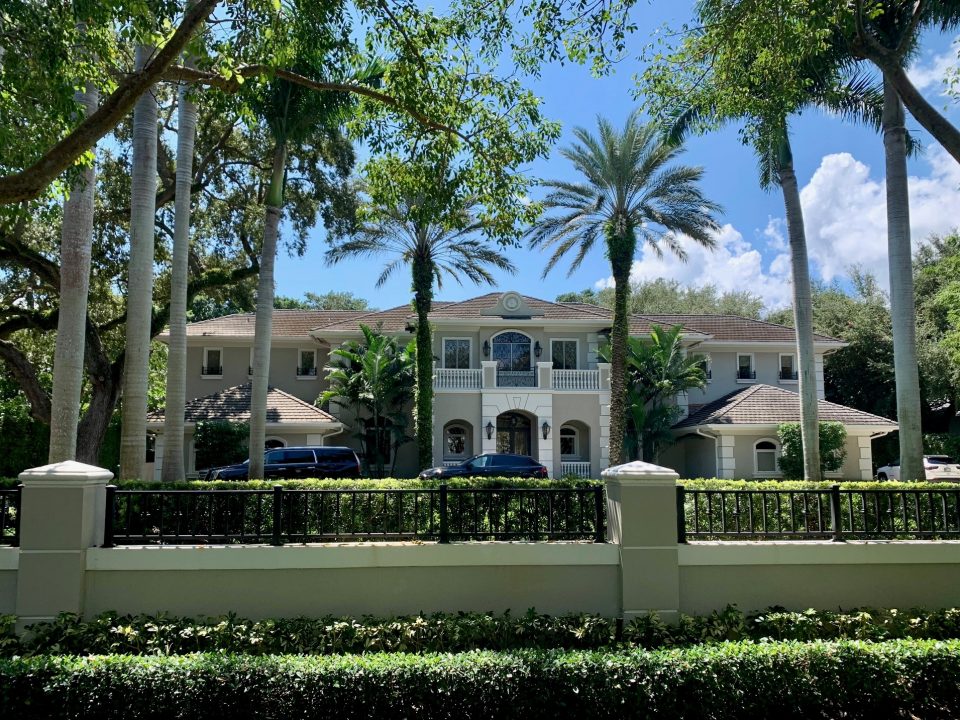
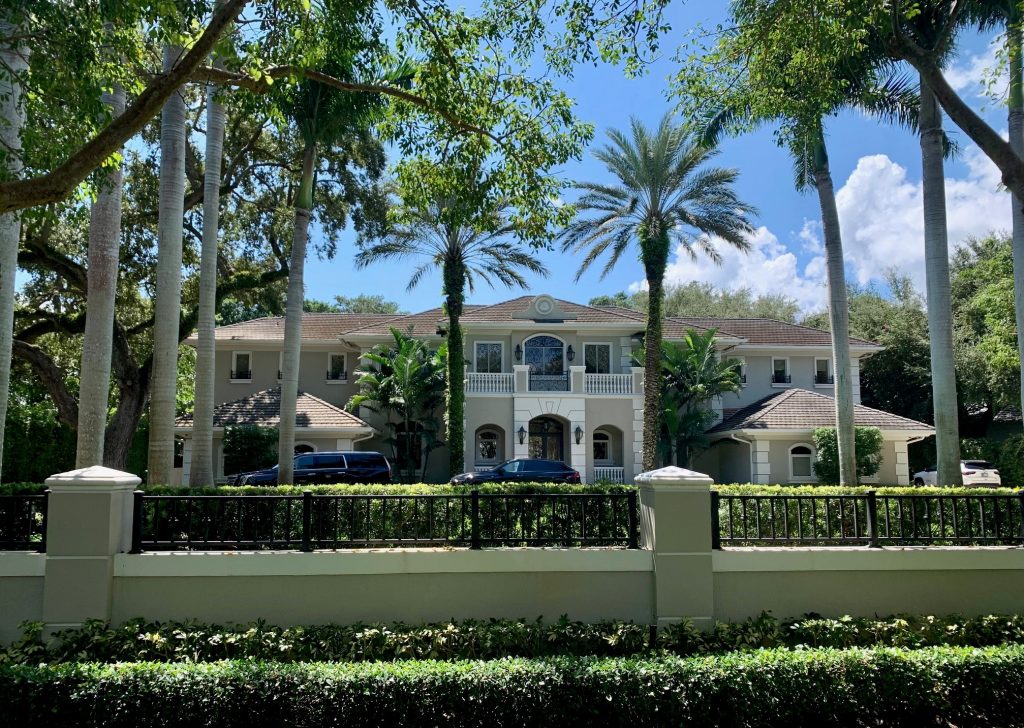
New Luxury Home Factor
New luxury homes are getting bigger. Pinecrest developers are building modern 6,000-10,000 SF estates with 6 and 7 bedrooms on acre properties. There’s been a big jump in the average SF of homes in 2016 – 17% or 711 SF more than in 2015.
Days on Market Indicator
Another telling sign of turnover in residential sales is the number of days a home is on the market. In 2016, the average days on market was a whopping 145 days, up by 49% over 2015. This is a strong indicator of how difficult it has been to move high end homes in the Village. There are a several reasons for this. There are simply fewer buyers. And many buyers strongly desire newer contemporary homes over older homes that have not been modernized. The non-updated homes are overpriced and do not sell until the asking price is adjusted to a realistic market value.
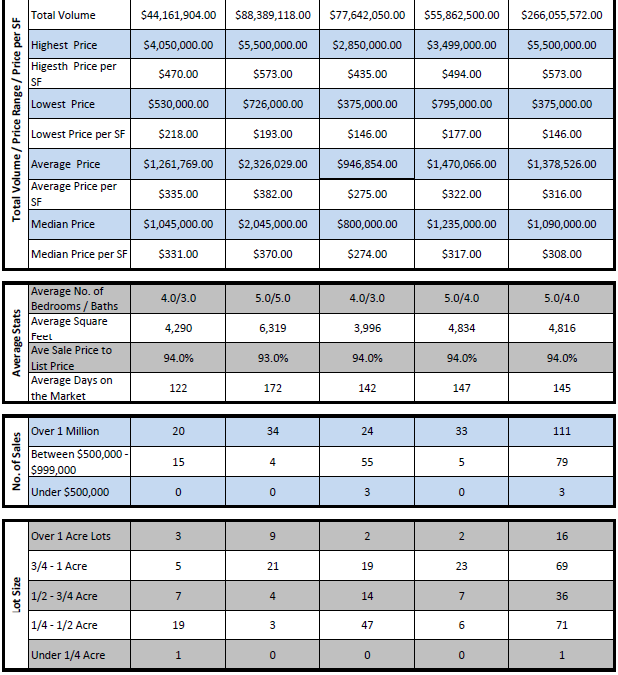
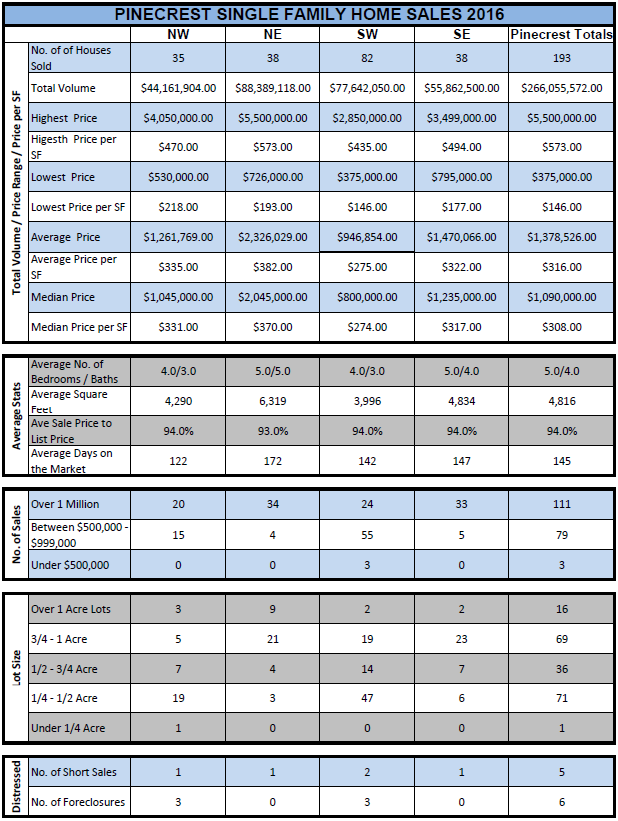
North, South, East and West – What Sells the Best?
The NE quadrant of Pinecrest consistently commands the highest sale price, average sale price, sale price per square foot (SP/SF) and average SP/SF. Last year proved no exception. Second place was a tie between the NW and SE quadrants. If you look at he numbers, the NW had the 2nd highest sale price and average sale price/SF while the SE had the 2nd highest SP/SF and the average sale price. If you look at the map below, you’ll notice that most properties east of 69th Av. are acres (in green) explaining much of the difference in sales price. As you approach the smaller parcels of land and those acres closer to US1, values are reduced.
Short sales were down by 50% and foreclosures up by 33% but these numbers are not significant as they reflect less than 6% of sales.
The sales numbers in this report reflect all sales listed in the MLS but not homes sold by owner.
Pinecrest Home Sales 2015 – The Annual Report
Pinecrest Home Sales 2014 – The Annual Report
The Village of Pinecrest 2013 Market Report – The Year in Review
I’m an estate specialist in The Village of Pinecrest and your best source for news and information on Pinecrest real estate. If you would like to schedule a buyer, seller or investor meeting, please call, text or email me. 305-898-1852 Wellins.D@ewm.com