The Village of Pinecrest 2013 Market Report – The Year in Review
In The Village of Pinecrest, 228 homes single family homes sold in 2013 with a total sales volume of $254,928,575. Sales ranged from $305,000 to $3,800,000.00 with an average sale price of $1,118,108 and an average price per square foot (SF) of $256. The average sale price increased 13% and the average price per SF increased by 9% over 2012 values.
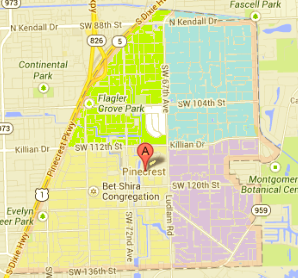
In the exhibit below, Pinecrest is divided into approximate quadrants to evaluate the statistical differences within the community. North and south is divided by 112th St and east and west is divided by 67th Ave. Refer to the map on the right.
NE Pinecrest (blue)) had the highest sale at $3,800,000, the highest average and median sale price of a home and the highest average sale price per square foot (SF). This sector typically has the top sale and top averages. However, this year, the difference in the average price of a home in the NE sector when compared to all quadrants combined was up from 30% in 2012 to 37%. Properties that sold in the NE section had the highest number of sales over $1 million, the largest acreage, the most square feet of living space and the most bedrooms and bathrooms. Homes were on the market longer, averaging 136 days and sold for an average of 92.5% of sale price to list price. There was one short sale and three foreclosures.
NW Pinecrest (green) had the lowest total volume of sales at $45,823,500 with an average sale price of $1,091,036 and an average sale price per SF of $253. There was a fairly even distribution of homes sold over $1 million (18) and homes sold under $ 1 million (22) as well as a corresponding distribution of homes on lots under 1/2 acre (20) vs homes on larger parcels (22). Houses were on the market for an average of 106 days and sold for 93% of asking price. This sector had 4 short sales and no foreclosures.
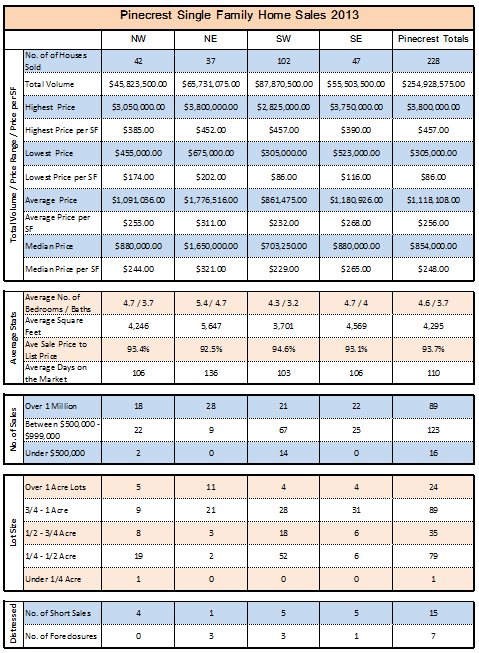
SE Pinecrest (purple) had the second highest sale at $3,750,000 and the second highest average sale price ($1,180,926) and average sale price/SF ($268). Sales statistics in the SE area are quite comparable to sales in the NW quadrant when looking at averages as well as numbers of bedrooms, bathrooms, square feet of living area and sales above and below $1 million. One very apparent difference between the NW and SE quadrants is the size of the lots, with the preponderance of homes in the SE sector on 1 acre lots. Homes here sold for an average of 93% of the asking price and were on the market an average of 106 days, equal to the NW quadrant. Even the distressed sales in the two quadrants were similar, with 5 short sales and 1 foreclosure in this area.
SW Pinecrest (yellow)) had the greatest number of sales at 102 but the lowest average and median sale price and average sale price per SF. Two factors affected the sales prices in this quadrant – smaller houses with an average of 4 bedrooms, 3 bathrooms and 3,701 SF of living space and smaller lot sizes with 52 homes on 1/4 to 1/2 acre. Although the majority of sales (67) were under $1,000,000, the SW sector had the highest average sale price to list price at almost 95%, meaning that properties sold closest to their asking price. And, despite having the lowest sale at $305,000, and the lowest sale price per SF of any sale at $86, one sale in this sector commanded the highest price per square foot at $457. The SW quadrant had 3 foreclosures and 5 short sales this year, although Pinecrest, as a whole, had only 10% distressed property sales.
Click here to see the 2012 Pinecrest Market Analysis – The Year in Review.
Click on this link Wellins.D@ewm.com to request a copy of the Pinecrest Market Analysis for 2013.
I am a luxury estate specialist in The Village of Pinecrest. If you would like to schedule a buyer, seller or investor consultation, kindly give me a call at 305-898-1852 or click on Wellins.D@ewm.com to send me a note. It would be my pleasure to provide you with a complementary home valuation.