Coconut Grove Market Report, Third Quarter 2026
Coconut Grove, Miami · Market Report · Third Quarter 2026
Single Family Homes Led the Quarter.
Condos Are Carrying the Inventory.
Compared with the third quarter of 2025, single family closed sales in Coconut Grove rose from 36 to 52 (+44.44%), and the price per square foot climbed from $990 to $1,328. Condos have the most choice: 139 of the 224 active listings. Townhomes sold more slowly, with days on market up from 35 to 74.
Where the Market Stands
Coconut Grove had 112 closed sales in the third quarter, up from 100 in the same quarter of 2025. Single family homes drove it.
Between July and September 2026, Coconut Grove had 112 closed sales. A year earlier it was 100, a change of +12.00%. Single family homes made up 52 of those sales, condos 45, and townhomes 15. At the end of September there were 224 active listings and 41 pending sales.1
Price per square foot went up in all three property types. Days on market stayed about the same for single family homes, came down a little for condos, and went up a lot for townhomes. Let’s take each one in turn.
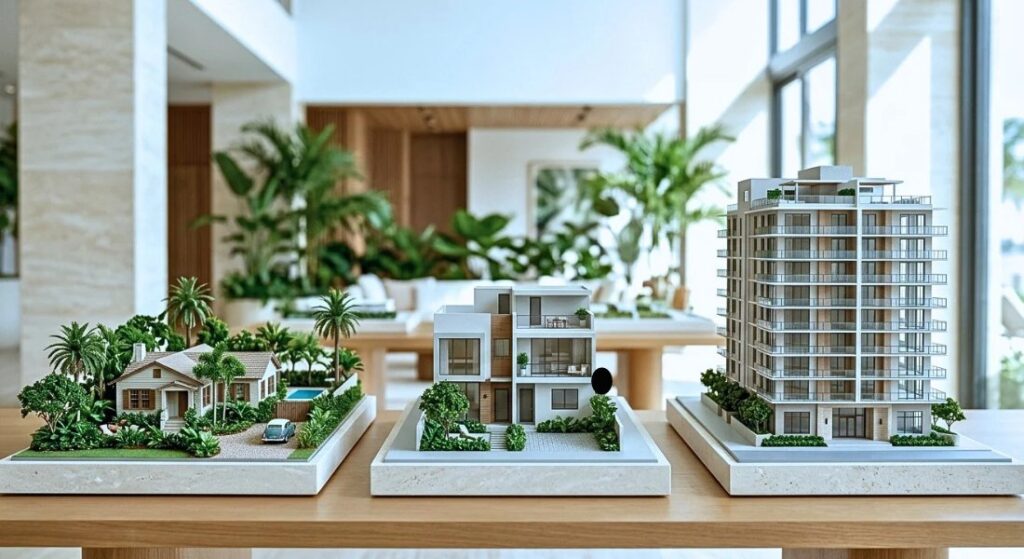
Coconut Grove is really several markets in one: single family homes in North Grove and South Grove, a townhouse community, and condos. Mortgage rates are in the area of 6.5%, and sales still rose. That’s worth knowing if you’re deciding whether to move.
Single family homes set the pace, condos hold most of the supply, and townhomes moved more slowly.
Single Family: More Sales at a Higher Price per Square Foot
Compared with the third quarter of 2025, single family closed sales rose +44.44% and the price per square foot climbed +34.14%.
Single family homes had 52 closed sales in the third quarter, up from 36. The average sale price was $4,328,216, up from $3,453,618. Price per square foot reached $1,328, up from $990.
Homes sold for 94% of list price, compared with 93% a year ago. They spent 86 days on the market, against 88.
Price per square foot rose +34.1%, while the average sale price rose +25.3%. That tells us it isn’t only bigger or more expensive homes selling. Each square foot is bringing more.
There are 72 active listings and 14 pending sales. That’s 4.2 months of supply, which favors sellers.1
Coconut Grove is the hottest community right now. Everybody wants to live in the Grove, and there’s very little inventory. It’s tough to find a quality home.
Debra Wellins, Berkshire Hathaway HomeServices EWM Realty
Why Many Owners Stay Put
Low supply is partly about why owners choose to stay in the homes they have.
There are 72 active single family listings, about 4.2 months of supply. That’s somewhat low, and fewer homes come to market than demand would suggest.1 Many owners have a mortgage rate from 2020 or 2021 that’s far below what a new loan costs today. That changes the math of moving.
Why aren’t people selling? It’s clearly because of finances. They don’t want to sell and buy something with a higher mortgage rate in the 6.5% area. If they bought back during COVID, especially in ’21, they’re locked into a sweet 3% rate. Considering the cost of moving and the financial trap of losing their low legacy interest rate, the financial incentives aren’t there.
Debra Wellins, Berkshire Hathaway HomeServices EWM Realty
If you’re buying, get prepared. Homes sold for 94% of list price on average, so there’s some room to negotiate.
Condos: Steady Sales, Deep Supply
Condo sales rose +12.50% to 45, but 139 active listings against 20 pending sales give condos the most choice of any property type in Coconut Grove.
Condos had 45 closed sales in the third quarter, up from 40. Price per square foot rose +25.02% to $1,284, from $1,027. Days on market came down to 84 days from 95.
Condos sold for 93% of list price, down from 94%. Buyers have some room to negotiate.
At the end of September there were 139 active condo listings and 20 pending. That’s 9.27 months of supply.1
The average condo sale price was $2,769,311, against $1,651,954 a year ago. In a segment this small, that number moves with whichever units close in a quarter. Price per square foot is the steadier comparison.
Coconut Grove has five or six new condo towers, and they’re priced at the top of the market. The units tend to be compact, but the views are good and it’s walkable. Buyers are paying for the setting as much as the square footage, and the $1,284 figure reflects that.
Townhomes: Fewer Sales, Slower Pace
Townhome sales fell from 24 to 15, and time on market more than doubled, from 35 days to 74.
Townhomes had 15 closed sales in the third quarter, down from 24. Days on market rose to 74 days from 35. Price per square foot rose 6.9% to $803, from $751.
Homes sold for 97% of list price, compared with 96% a year earlier.
Closings slowed through the quarter: 8 in July, 4 in August, and 3 in September. Monthly price per square foot was $783, $902, and $746, an uneven path for a segment this small. With 13 active listings and 7 pending, supply is 2.6 months at the quarter’s pace.1
Townhomes sold more slowly, but price per square foot held up, rising 6.9% on the year.
Month by Month: July, August, and September
The quarter in three parts for each property type. Monthly averages move with which homes close, so read them as a rhythm, not a trend.
Single family homes closed 14 in July, 23 in August, and 15 in September. Condos closed 17, 13, and 15. Townhomes slowed from 8 closings in July to 4 in August and 3 in September.1
Average sale price jumps around from month to month, because a few high priced closings can lift an entire month. Price per square foot is the steadier measure.
| Month | Closed Sales | Avg. Sale Price | $/SF | Days on Market | Sale to List |
|---|---|---|---|---|---|
| July | 14 | $6,533,571 | $1,526 | 120 | 94% |
| August | 23 | $3,049,444 | $1,240 | 74 | 94% |
| September | 15 | $4,230,667 | $1,277 | 68 | 94% |
| Month | Closed Sales | Avg. Sale Price | $/SF | Days on Market | Sale to List |
|---|---|---|---|---|---|
| July | 17 | $3,629,412 | $1,373 | 79 | 93% |
| August | 13 | $1,792,039 | $1,117 | 70 | 94% |
| September | 15 | $2,641,500 | $1,318 | 98 | 92% |
| Month | Closed Sales | Avg. Sale Price | $/SF | Days on Market | Sale to List |
|---|---|---|---|---|---|
| July | 8 | $1,610,500 | $783 | 56 | 98% |
| August | 4 | $2,168,750 | $902 | 125 | 98% |
| September | 3 | $1,455,000 | $746 | 55 | 94% |
Single family average price ran from $6,533,571 in July to $3,049,444 in August. That’s the mix of homes that closed, which is why price per square foot is the steadier comparison.
Market Detail by Property Type
Third quarter 2026 compared to the third quarter of 2025.1
| Property Type | Sales Q3 2026 | Sales Q3 2025 | YoY Sales | Avg. Price 2026 | Avg. Price 2025 | YoY Price |
|---|---|---|---|---|---|---|
| Single Family | 52 | 36 | +44.44% | $4,328,216 | $3,453,618 | +25.32% |
| Condos | 45 | 40 | +12.50% | $2,769,311 | $1,651,954 | +67.64% |
| Townhomes | 15 | 24 | −37.50% | $1,728,267 | $1,743,771 | −0.89% |
| Property Type | $/SF 2026 | $/SF 2025 | YoY $/SF | Days on Market 2026 / 2025 | Sale to List 2026 / 2025 |
|---|---|---|---|---|---|
| Single Family | $1,328 | $990 | +34.14% | 86 / 88 | 94% / 93% |
| Condos | $1,284 | $1,027 | +25.02% | 84 / 95 | 93% / 94% |
| Townhomes | $803 | $751 | +6.92% | 74 / 35 | 97% / 96% |
Months of Supply by Property Type
Sorted from tightest to loosest. Green favors sellers, blue is balanced, orange favors buyers.
In plain terms, months of supply is how long today’s listings would last at the current pace of sales. It equals active listings at the end of September divided by third quarter closed sales divided by 3. Townhomes are at 2.60 months, single family at 4.15, and condos at 9.27.1
What This Means for Sellers and Buyers
Each property type calls for a different approach in Coconut Grove right now.
On the Ground: Listing Around the Holidays
November and December tend to be the slower months, but they are not dead months.
Some sellers want to close before the end of the year, and some buyers have to buy because they’re relocating for work. Good sales still happen. For a seller, the question is timing, not whether to list.
If a seller asks me, should we list now? My answer depends. From the second week of December until after the New Year, I recommend waiting if showings will interrupt enjoyment of the holidays. Sellers don’t want the disruption of buyers coming into their home. However, if a seller is out of town for the holidays, it can be advantageous to list it now. People have more time to see homes during the holiday, family members are in town, and serious buyers have far fewer homes available to see, so competition is less.
Debra Wellins, Berkshire Hathaway HomeServices EWM Realty
Preparation matters more than the calendar. Whatever the season, get the home cleaned, decluttered, and photographed at its best before it goes live. Fresh paint, new flooring where the old is worn, and some landscaping for curb appeal are the usual first steps.
Frequently Asked Questions
Why did Coconut Grove single family sales rise +44% in the third quarter?
Single family homes had 52 closed sales between July and September 2026, against 36 in the same quarter of 2025. There are 72 active listings and 14 pending sales, or 4.2 months of supply.1
Why is single family price per square foot up +34% when the average sale price is up +25%?
Price per square foot rose from $990 to $1,328. The average sale price rose from $3,453,618 to $4,328,216. Because the per square foot gain is larger, it acts as an equalizer, scaling a home’s cost to its physical size. It compares homes of different overall sizes by looking at the cost per unit of living space.1
Is Coconut Grove a buyer’s market or a seller’s market?
It depends on the property type. Single family homes have 4.2 months of supply and somewhat low inventory, so it’s a seller’s market. Townhomes have 2.6 months, which also favors sellers, though there aren’t many sales. Condos have 9.3 months, with 139 active listings against 20 pending, so buyers have more room.1
Why did townhome days on market double?
Townhomes in the Grove are super popular. The older Mediterranean style townhomes are not selling as fast as the new modern builds, unless updating costs are factored into the list price.
How should I price a Coconut Grove condo right now?
Condos have 139 active listings and 9.3 months of supply. Condos sold for 93% of list price, against 94% a year ago. Price against like units competing with yours today. Use recent price per square foot or the sale price of comparable units as your guide, since average sale price and price per square foot fluctuate greatly from new builds to older towers.1
Should I list my Coconut Grove home over the holidays?
November and December tend to be slower, but sales still close, and some buyers are relocating or visiting family while they look. If you’ll be home for the holidays, listing in January avoids showings from the second week of December through the end of the holidays. If you’ll be away, listing now works well.
What does months of supply mean and how is it calculated in this report?
Months of supply is how long current inventory would last at the recent pace of sales. It equals active listings at the end of September divided by third quarter closed sales divided by 3. Under 5 months favors sellers, 5 to 7 months is roughly balanced, and over 7 months favors buyers.1
Who should I talk to about buying or selling in Coconut Grove?
Debra Wellins is a luxury real estate advisor with Berkshire Hathaway HomeServices EWM Realty who works across Coconut Grove, Coral Gables, Pinecrest, and greater Miami. She can explain where your property type and price point stand today.
Thinking About Buying or Selling in Coconut Grove?
Single family homes, condos, and townhomes are moving at three different speeds. Get a clear read on where your home or your search stands.