Comparison of 1st Quarter and 2nd Quarter Sales in Pinecrest
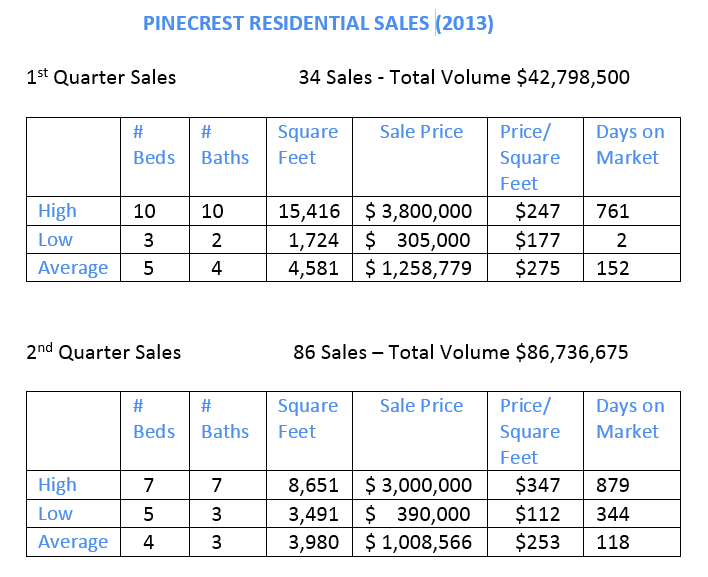
Pinecrest sales were robust in the second quarter compared to the first. Eighty six homes sold in the second quarter while only 34 homes sold in the first. Take a look at the charts below to compare the high, low and average sales in the Village of Pinecrest for the first and second quarters.
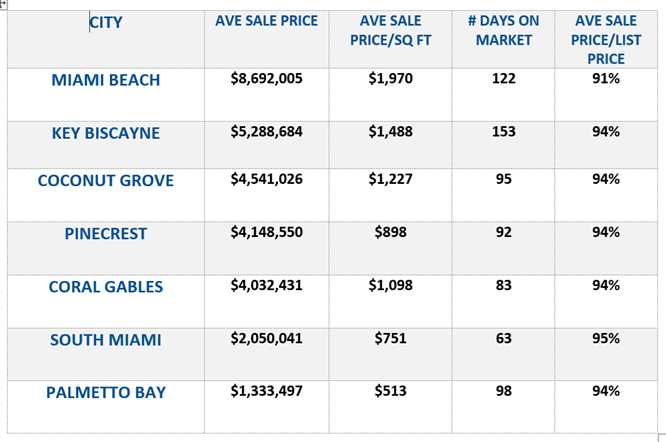
Except for the increase in total number and volume of homes sold, the average square feet of living space and average price per sale have decreased along with a more telling number, the average price per square foot, that has actually declined by 17%. This is in direct contrast to the price per square foot increases in neighboring Coral Gables communities to the east. The average home also sold for 94% of asking price.
Forty four percent of homes sold in both the first and second quarters were located in the southwest quadrant where lots tend to be smaller and prices lower. In the second quarter, 10 homes sold in the northeast, 21 homes in the southeast, 17 homes in the northwest and 38 homes in the southwest quadrants of Pinecrest.
Click here for a price breakdown of Village of Pinecrest – 2nd Quarter Sales
Click on the following links for Coral Gables Price Per Square Foot Reviews: Gables by the Sea and Snapper Creek Lakes
I am a Pinecrest luxury residential specialist. If you would like to schedule a buyer or seller meeting, please give me a call at (305) 898-1852 or email me at Wellins.D@ewm.com.
