Pinecrest Home Sales 2014 – The Annual Report
 The numbers are in for 2014 single family home sales in the Village of Pinecrest. These numbers reflect all sales listed in the MLS but not homes sold by owner.
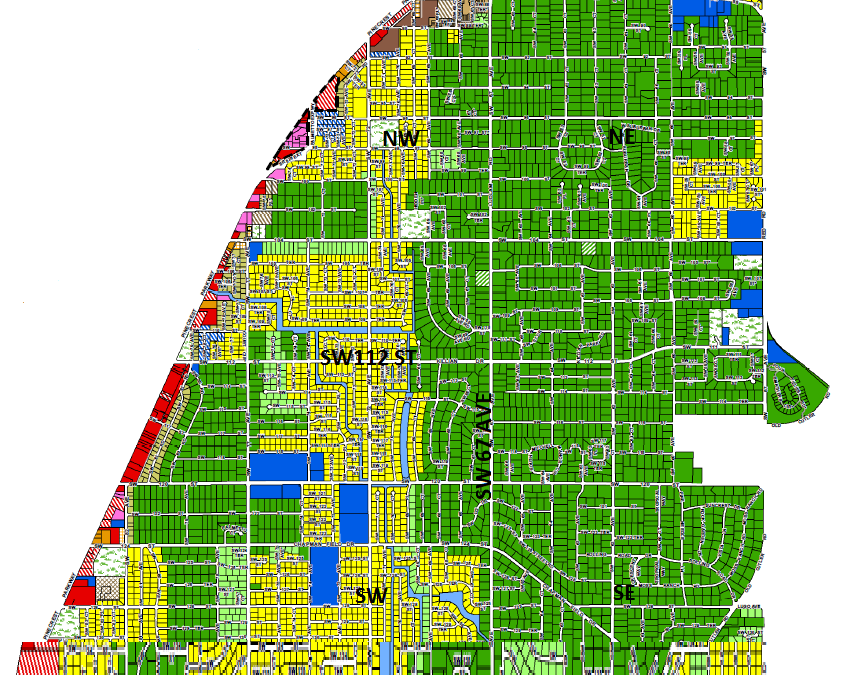
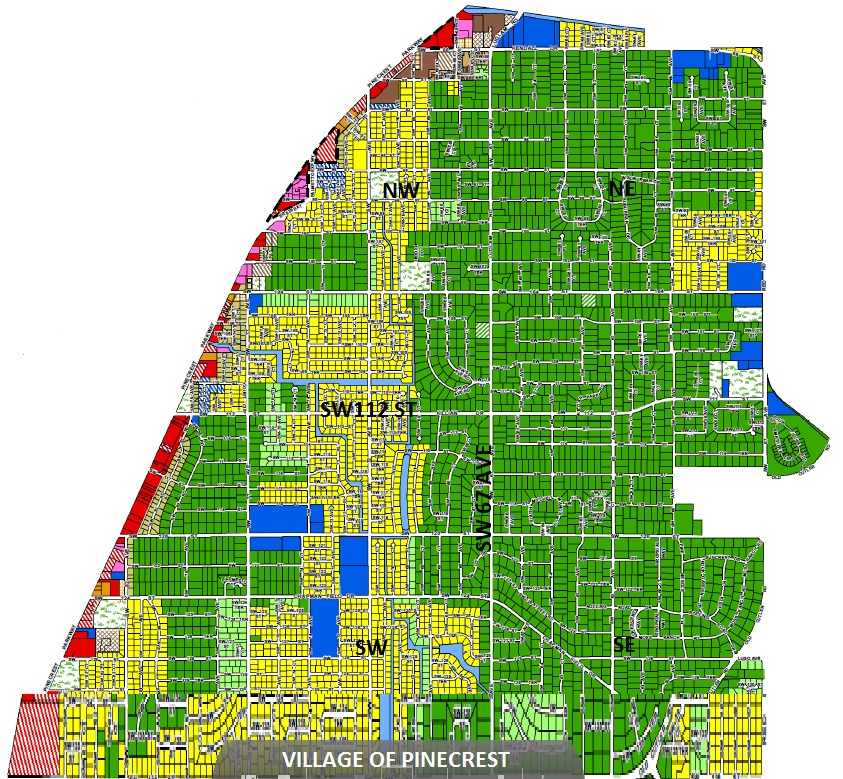
Each year, I brake down Pinecrest sales by quadrants, with SW 112th Street representing the division between north and south and SW 67th Avenue representing the division between east and west.
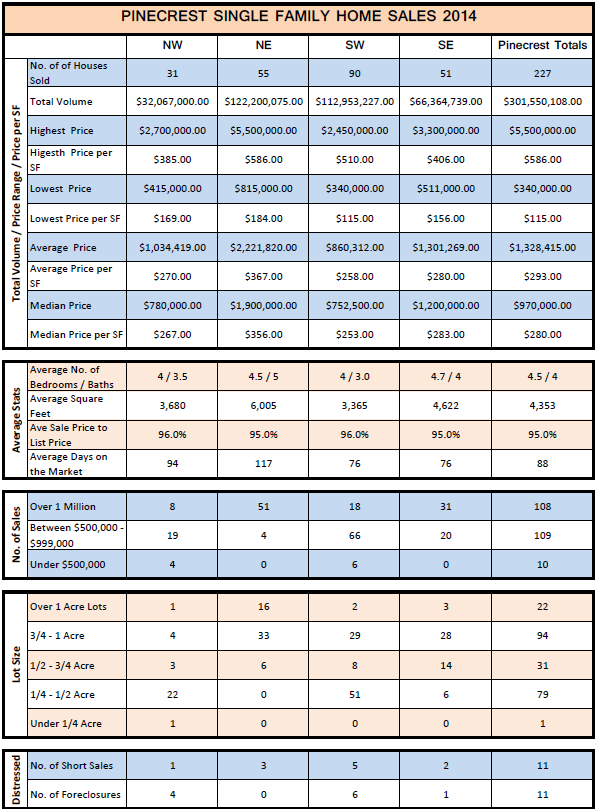
The chart below is self explanatory, but I’d like to point out the relevant changes between 2013 and 2014 that are the most interesting.
- The 2014 total volume in sales was up 18% over 2013. Although the same number of properties sold last year as in 2013 , the total sales volume was up by $47 million.
- The average sale price of single family homes was up 19%. Last year, the average home sold for $210,000 more than in 2013.
- The average sale price per square foot (SP/SF) was up 14%. In 2013 the average SP/SF was $256, while last year, the average SP/SF was $293, up a total of $37/SF.
When looking at the 2014 sales numbers, the NE quadrant consistently commands higher prices followed by the SE quadrant. It is important to keep in mind that lower values in the NW and SW quadrants are partially due to the higher density of homes on smaller lots in these sectors. Check out the map.
A really hot area that is frequently overlooked by buyers is an area I call the Ludlam Corridor. Just one block west of 67th Ave is a bounty of gorgeous acre properties with mature oaks on quiet, low-traffic streets. Developers are purchasing these properties in a frenzy. My advise to buyers: don’t get hung-up on the NE Pinecrest mystique.
Click here to see Pinecrest Land Sales for 2014.
To see the Pinecrest Market Report for 2013 click this link.
I am an estate specialist in the Village of Pinecrest. If you would like to schedule a buyer, seller or investor consultation, please call or text me at 305-898-1852 or send me a message at Wellins.D@ewm.com.

