Pinecrest Home Sales 2015 – The Annual Report
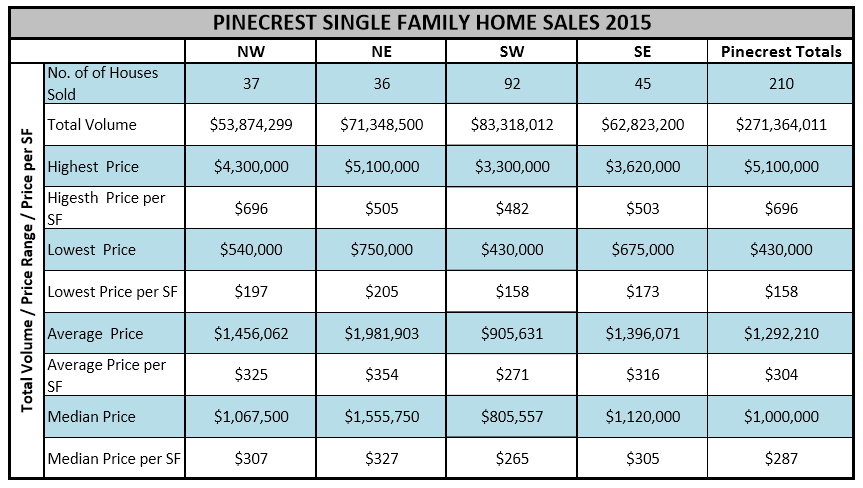

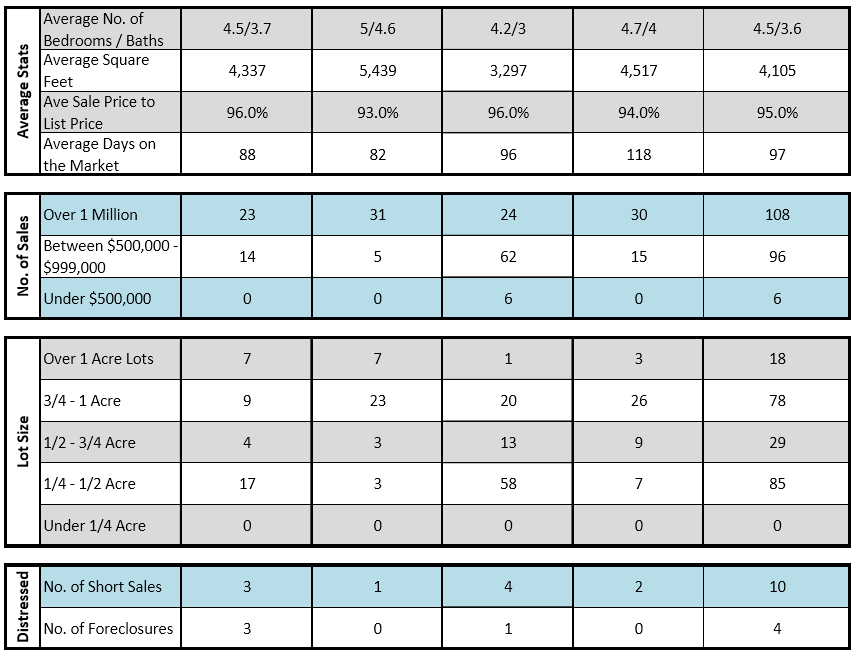
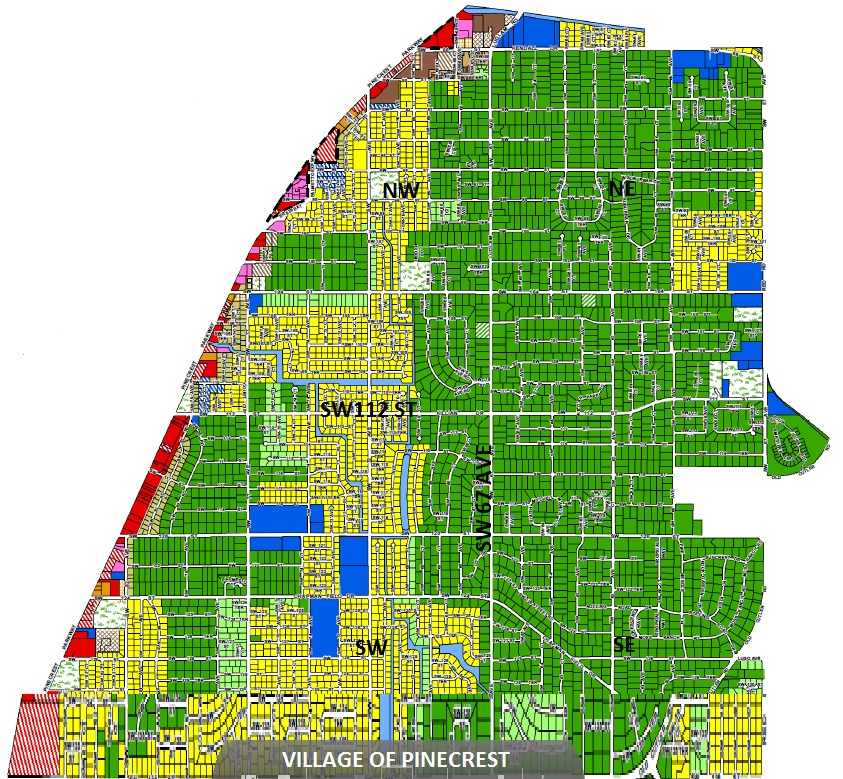
Each year, I create a comprehensive market report that subdivides single-family home sales in the Village of Pinecrest into quadrants, with SW 112th Street representing the division between north and south and SW 67th Avenue representing the division between east and west. (See map below).
These numbers reflect all sales listed in the MLS but not homes sold by owner.
Pinecrest home sales in 2015 were slightly off from 2014.
- Total sales volume of single family homes was down $30 million or 10% in 2015.
- The average sale price was down $36,205 or 3% last year.
- The average sale price per square foot (SP/SF) was up $11 or 4% in 2015.
Over the past five years, the NE quadrant of Pinecrest consistently commands the highest sale price, the highest average sale price and the highest sale price per square foot (SP/SF). Last year followed the trend with one exception. The highest SP/SF was in the NW quadrant with the sale of a small tear-down home on a spectacular acre listed by moi.
In Pinecrest, many tear-downs are sold for land value which generates an inflated SP/SF value for the home. Nevertheless, there are quite a few of these tear-downs sold annually as lot values significantly exceed home values. And in the NW sector, the pocket of acre properties west of Ludlam and east of 70th Av. are fetching strong prices.
Village of Pinecrest Land Sales – 2015 Market Report
Pinecrest Home Sales 2014 – The Annual Report
The Village of Pinecrest 2013 Market Report – The Year in Review
I’m an estate specialist in The Village of Pinecrest and your best source for news and information on Pinecrest real estate. If you would like to schedule a buyer, seller or investor meeting, please call, text or email me. 305-898-1852 Wellins.D@ewm.com

