Village of Pinecrest 2020 Real Estate Report – What a Year!
3D rendering of an upscale modern mansion with pool
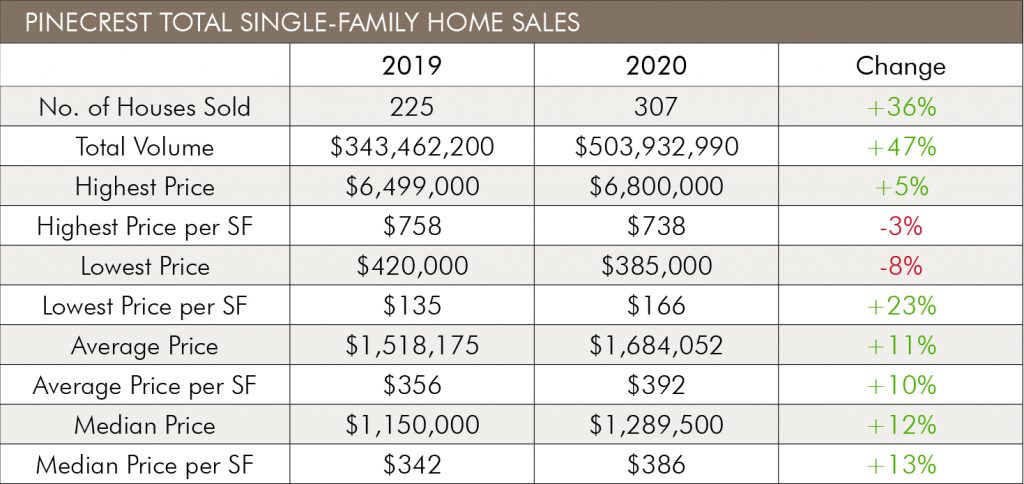
The Village of Pinecrest 2020 Real Estate Report is out and what a year it’s been. Single-family home sales were nothing short of amazing last year.
The number of sold homes increased 36%, the average sale price and price per square foot (PPSF) increased 11% and the median sale price and PPSF were up 22% and 13%, respectivley.
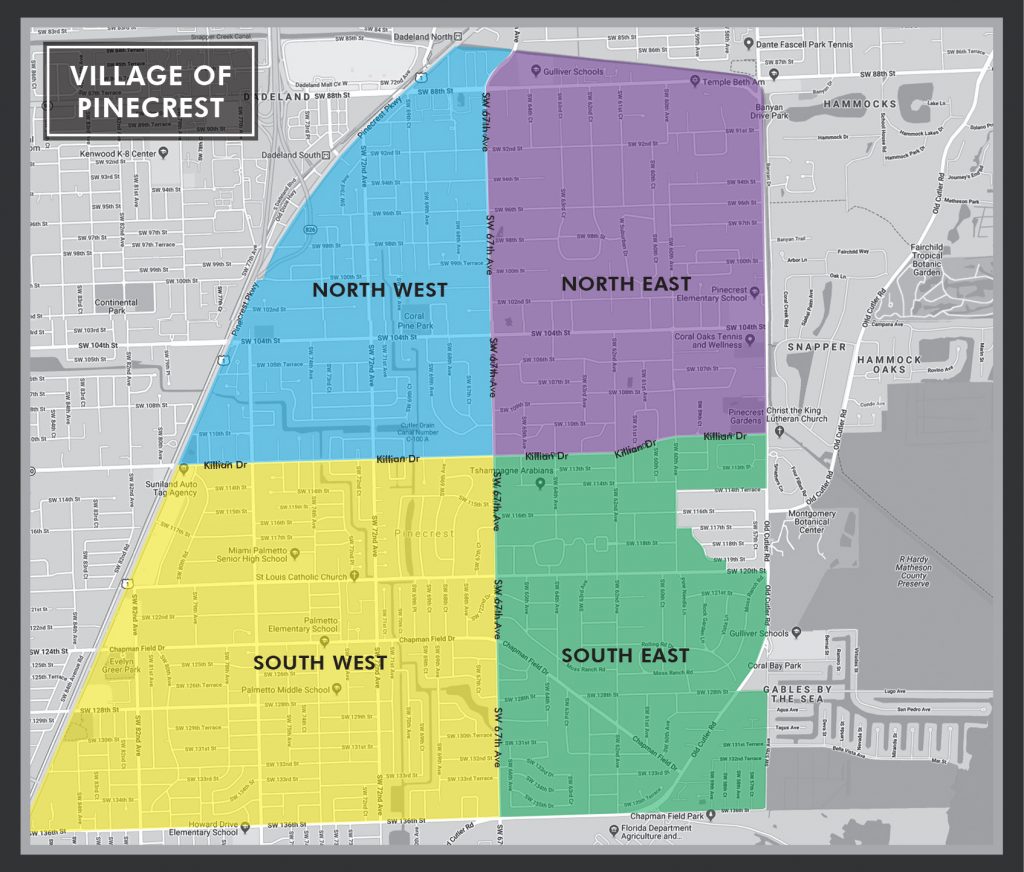
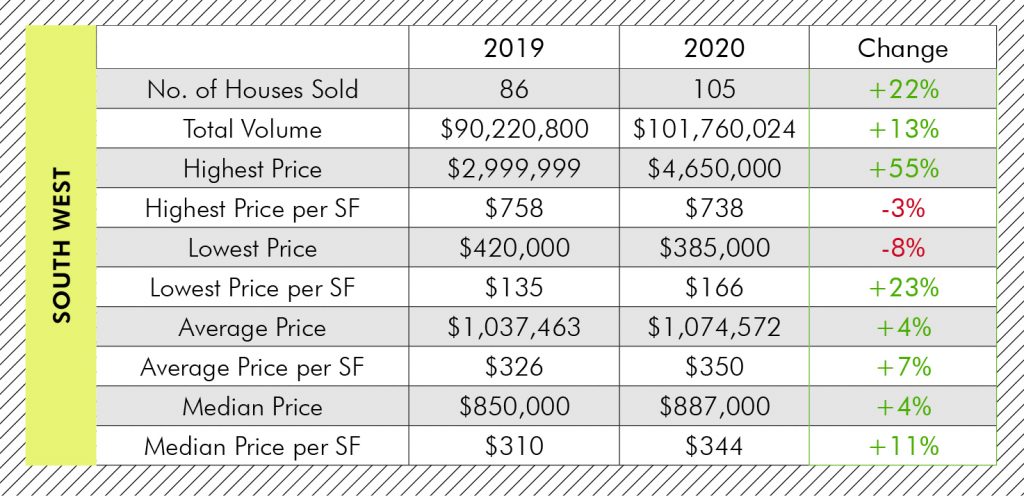
You’ll see on the map and charts that Pinecrest is analyzed by sectors with SW 67th Ave dividing East-West and SW 112th St. dividing North-South. Property values in our Village vary greatly depending on many factors, but smaller lot size and location explain the greater number of sales and lower prices in the SW section.
The Sector Data
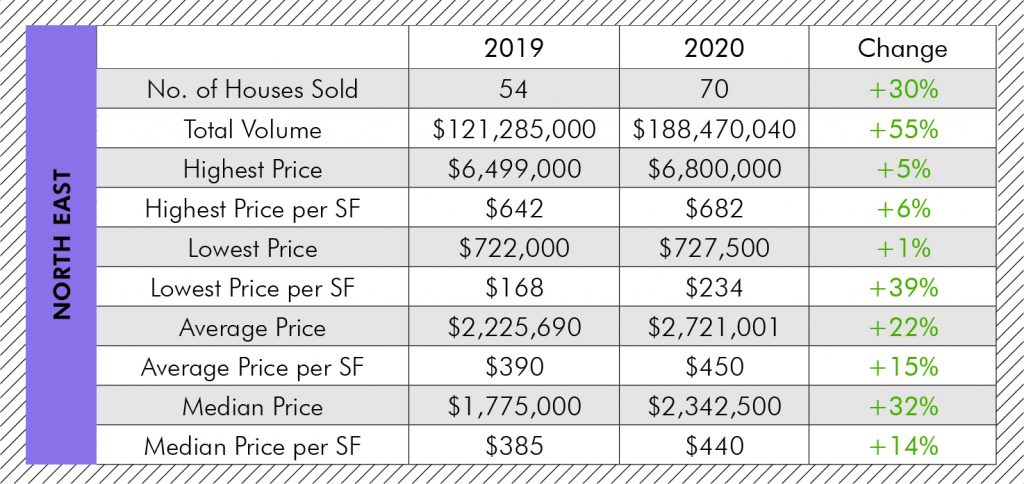
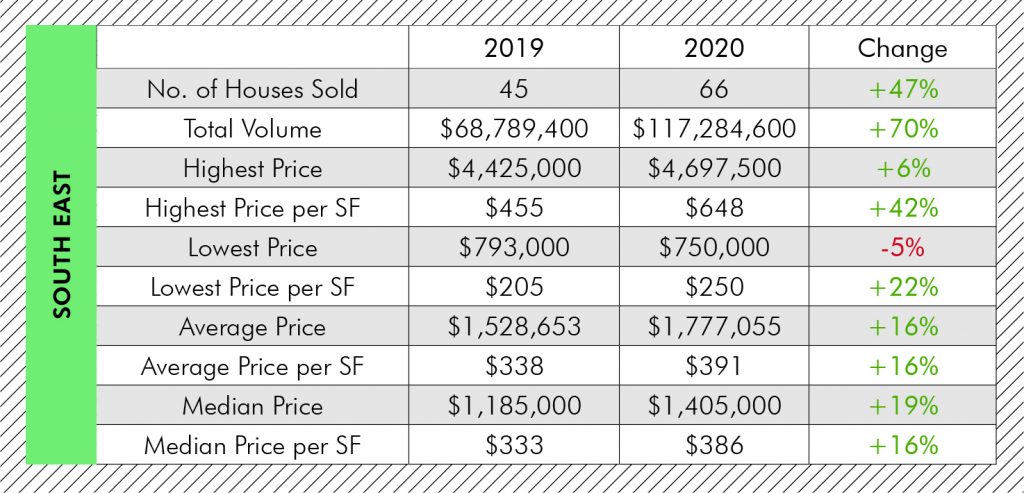
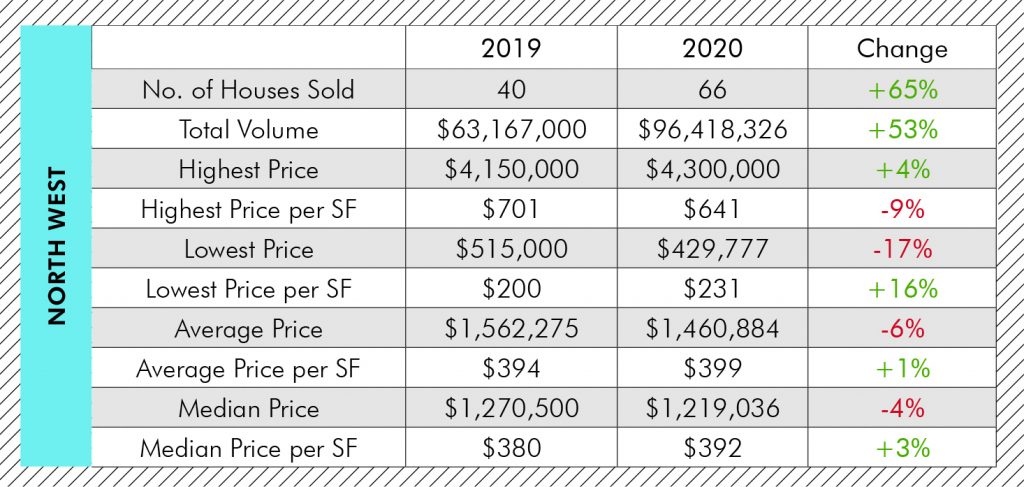
The NE sector had the highest average and median sale price and PPSF, averaging $450/SF, up from $390/SF in 2019. The SE sector had the next highest average and median sale price and the NW sector the second highest average and median sale PPSF.
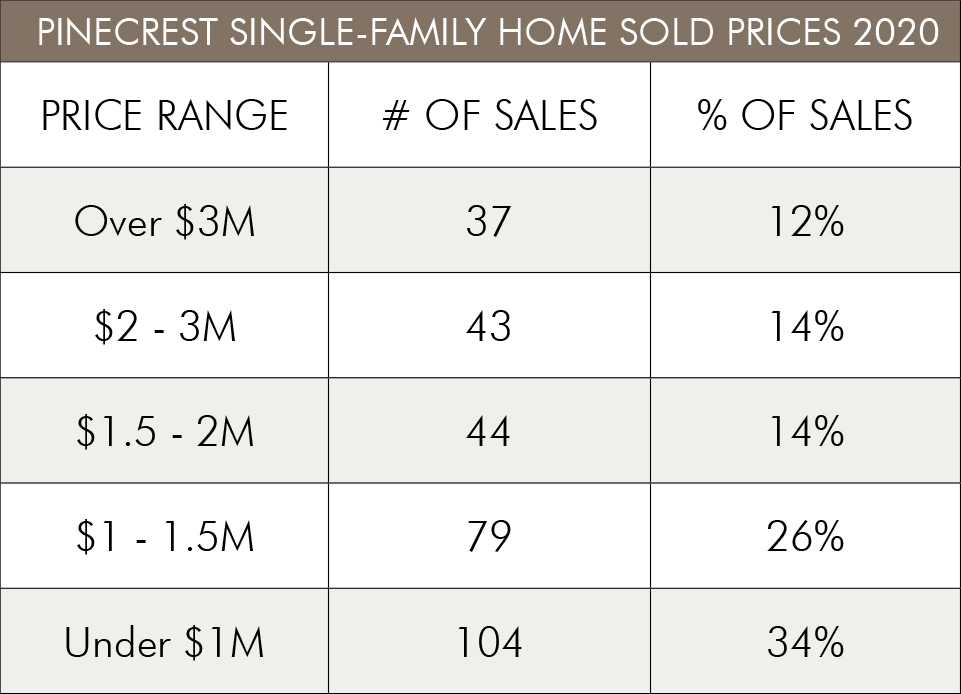
Sale Price Range
Sixty percent of single family home sales were under $1.5 million, a large and competetive segment of the market in Pinecrest, especially for first time home buyers. As price increases, there are fewer buyers for a smaller percentage of homes on the market. The $1.5 – 3 million range realized 28% of sales and above $3 million, 12% of total sales.
More Interesting Metrics
Days on Market is an important metric of price and its relationship to sales. In the higher priced NE sector, homes were on the market an average of 38 days longer than the NW sector, where the average home sale was 46% lower. The surprise last year was how long it took to sell homes in the SW area where prices were the lowest and homes usually sell the fastest. The SW area posted an average of 152 days on market while the NE sector was 162 days. Many homes intially over-priced, sold quickly once the price was adjusted.
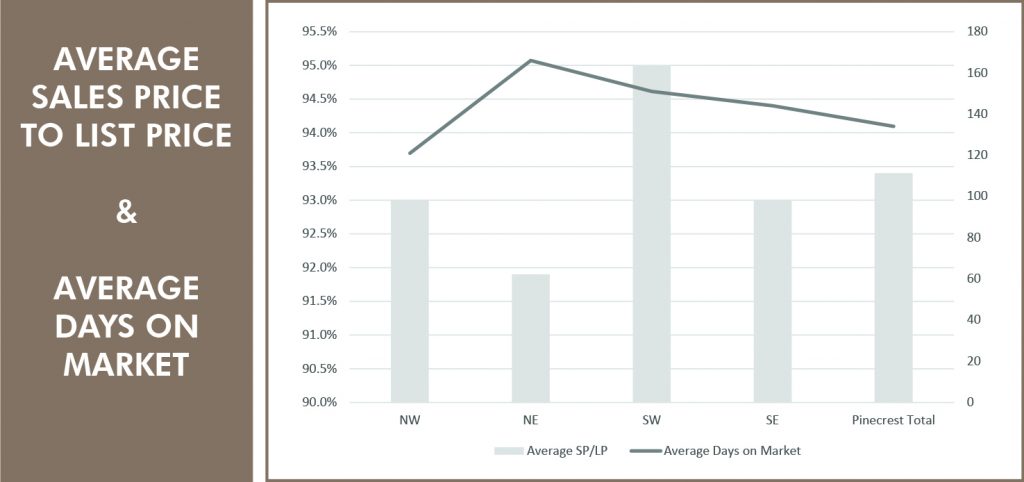
The other metric in this graph is the % sales price to list price. Pinecrest homes sold at an average of 92-95% sale price to list price. Keep in mind that these percentages do not take into account price reductions. The percentage does not reflect the original list price to sale price but calculates final list price to sale price.
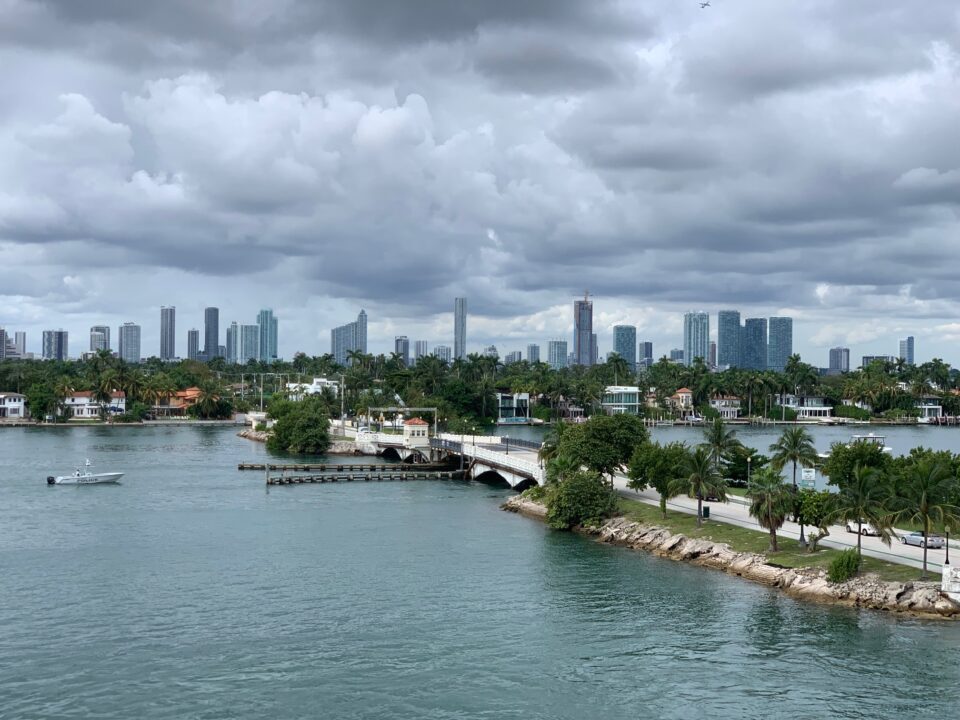
Buyers in 2020 were incredibly enthusiastic about purchasing homes in Pinecrest with our gorgeous acre properties, fabulous schools and parks and excellent police force. Pinecrest has such a great rural vibe, removed from the frenzy of urban life, yet plentiful in ammenities and a 30 minute drive or Metrorail ride to Brickell and Downtown Miami.
The Covid factor also played into buyer motivation to relocate to Pinecrest. While the world shut down, real estate sales, to everyones surprise, ramped up. Virtual showings became my norm with live walk-throughs on Facetime, Instagram and Facebook, a staple of all my listings. The limited in-person open houses no longer included delicious lunches and champagne cocktail hours. Instead, the focus was on CDC protocols and safety. It all worked quite seamlessly as homes sales rocketed.
And the robust buying trend continues in 2021, despite low inventory and high demand, especially in the under $1.5 million market. It’s a superb time to sell so don’t hesitate to reach out to me to discuss your real estate needs in this hot seller’s market. Your home should be listed with an experienced top producer who will get you the best possible sale price. 305-898-1852 Wellins.D@ewm.com
Click here for Village of Pinecrest 2019 Real Estate Report
